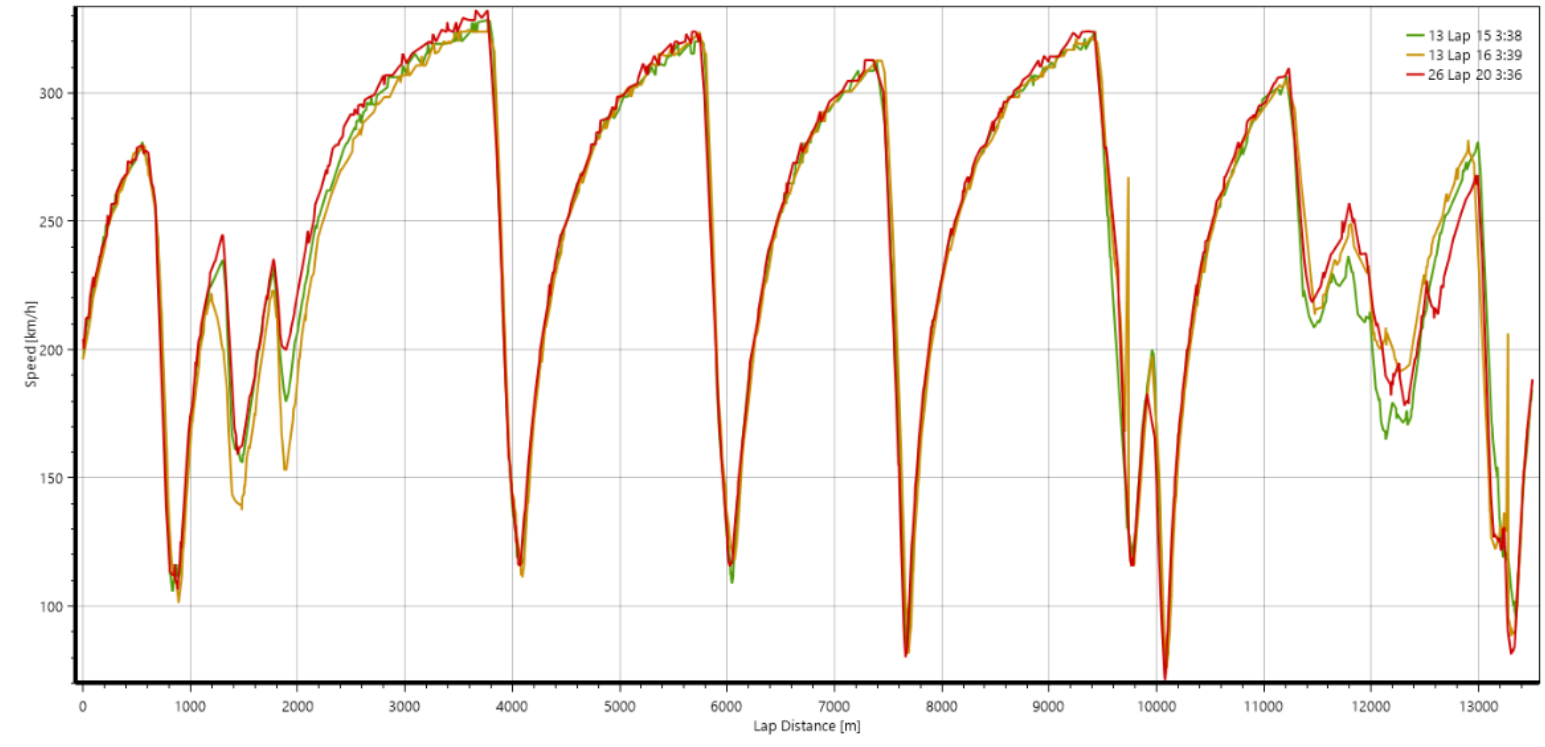
GPS Speed
In series where GPS data is available over the timing feed (such as WEC and Formula E) this data can be visualized in HH Timing. The speed traces and position on track (driving lines) of each car can be shown.
Since only GPS position data is received from the timing feed, the displayed GPS speed is calculated by differentiation the position data which has two main sources of error:
- error in the GPS position measurement
- numerical error from taking the derivative
GPS speed is not normally calculated by simply differentiating the position signal, but unfortunately in this case with the limited data available it is the only option. On top of this the data does not arrived timestamped, and therefore the time period between each point must be estimated. The result of all this is that the data shown in this view is an estimation at best, and although the data can be filtered to give a clean looking signal it should be viewed, with an understanding of the limitations.
The GPS speed graph can be created from the displays tab of the ribbon bar:
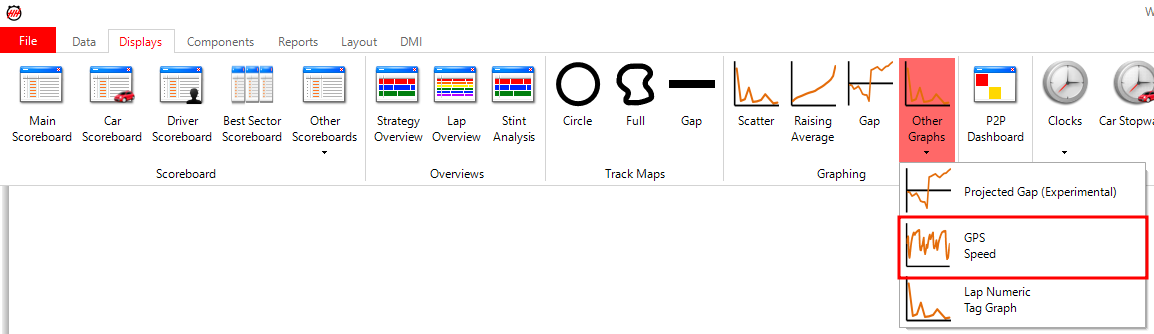
When the graph opens the ribbon bar for the view will look like:
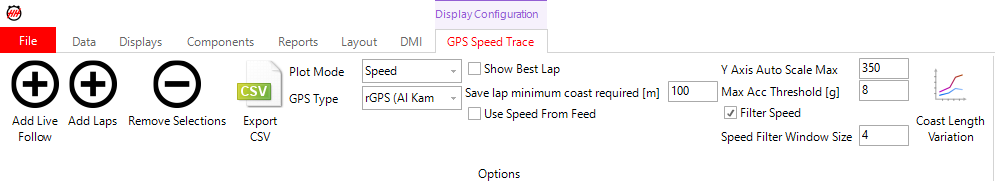
Using the GPS graph
Add live follow
The add live follow allows for laps to be automatically added and removed from the graph during a session:

Select the car, and which type of laps to display:
- Previous and current laps: the current lap will be shown live and the previous lap will also be shown on the graph. When the lap ends, the original previous lap will be removed automatically
- Cars ahead and behind: this shows the current and previous laps of the cars ahead and behind of the selected car, based on the overall position
- Best lap: this will always show the best lap of the selected car on the graph
- All save laps: this will show all laps classified as save laps for the current car on the graph
Add laps
The add laps button opens a window that allows laps from any car and any session to be loaded into the graph. Multiple laps can be selected.
Remove selections
This allows items to be removed from the graph.
Export CSV
This button will export the data from the graph into CSV files. One file will be created for each lap that is shown on the graph.
Other options
Plot mode
The plot mode allows the graph to be changed between showing the speed graph or the position graph which can be used to look at driving lines.
GPS type
This is the GPS type to use from the feed - it should be left with the default setting of rGPS.
Show best lap
If this checkbox is selected then the best lap of the current session will always be shown on the graph. Note that this only works if the GPS graph is open from the start of a live session, and it doesn't work with an activated session.
Save lap minimum coast required
This is the minimum coast distance for a lap to be considered as a save lap. For example, if the input is 100 m, then any lap with a single coast that is greater than 100 m in length would be marked as a save lap.
Use speed from feed
This should always be left to false as there is no speed coming from the feed.
Y axis auto scale max
The maximum value for the y-axis on the graph. The graph can still be zoomed with the mouse, but this limits the absolute maximum of the y-axis.
Max acc threshold
See GPS speed calculation algorithm section.
Filter speed & speed filter window size
The filter speed checkbox allows the GPS graph to be filtered with a moving average filter to smooth the calculated speed signal. The window size text box allows the size of the window of the moving average filter to be specified. The window size refers to the number of points that will be considered in each moving average calculation (i.e. with a window size of four, two points ahead and two points behind each point will be used). The larger the window size, the more filtering will be applied, but the more skewed the graph becomes.
Elements on the graph
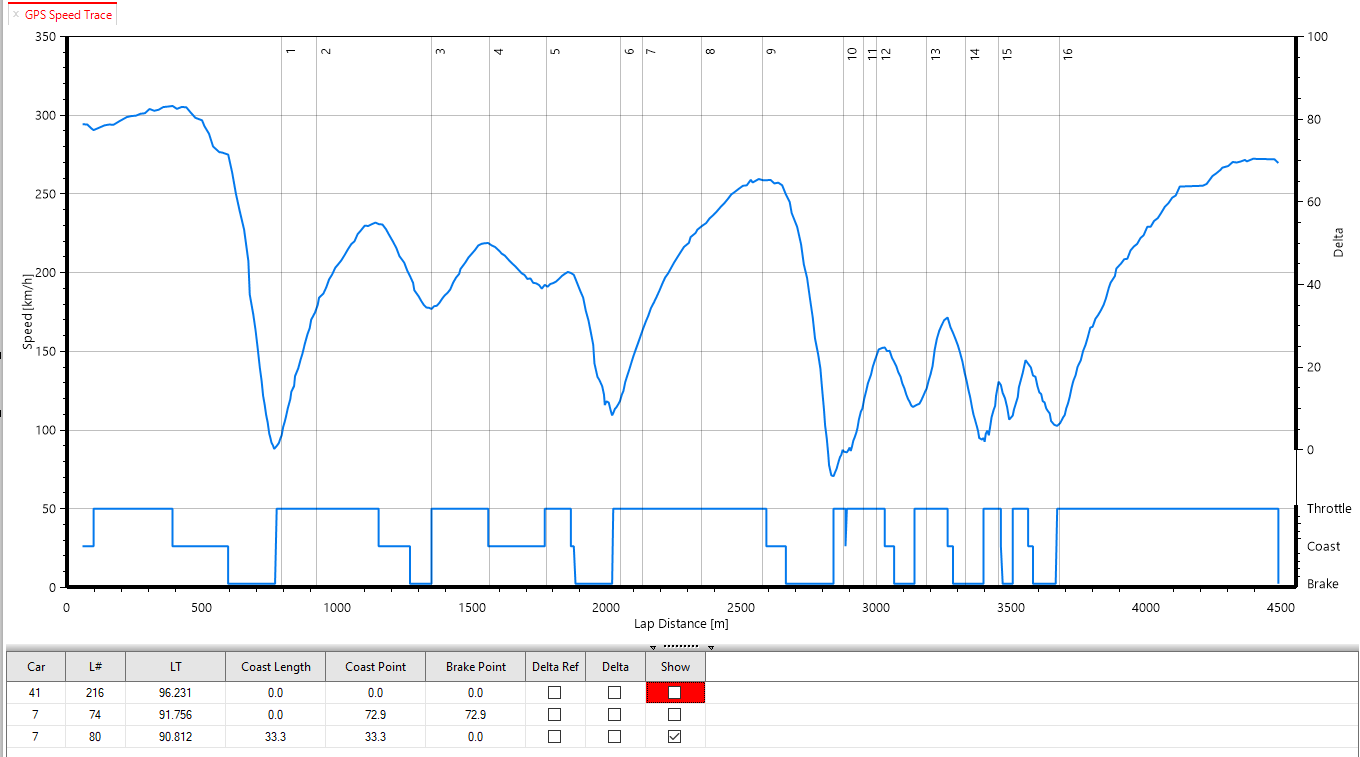
Corner markers
The vertical grid lines on the graph show the corners. These are calculated based on the selected track contour for the full track map.
Driver inputs
The driver inputs graph at the bottom of the graph shows the calculated driver input. This is calculated based on the derivative of the speed trace. A positive value gives acceleration, a value > -0.1 m/s/s gives coasting and a value < -0.1 m/s/s gives braking.
Lap list
The table at the bottom of the graph shows all the lap that have been added to the graph (either automatically using the live follow feature or manually). The columns show:
L#
The lap number.
LT
The lap time in seconds.
Coast length, coast point and brake point
A single right-click on the graph will set the brake zone analysis. In this example, the braking point for turn 9 has been selected by right-clicking in the general area of turn 9 on the graph. In the table, the calculated coast length for this braking zone is shown. The coast point and brake point are the number of meters before the center of the corner (detected as the minimum speed) that coasting and braking were detected.
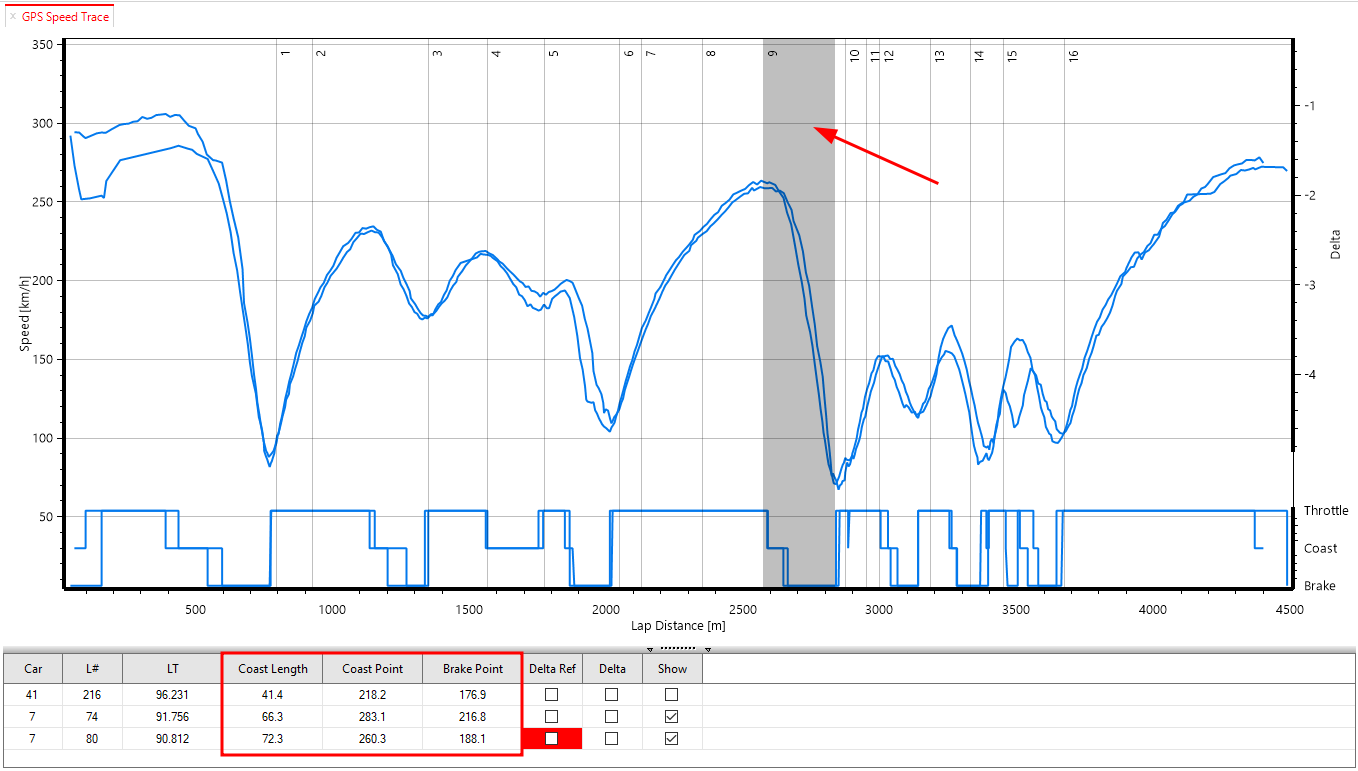
Clicking the coast length variation button on the ribbon bar will open a graph showing the coast length vs lap number for all laps and cars shown on the graph.
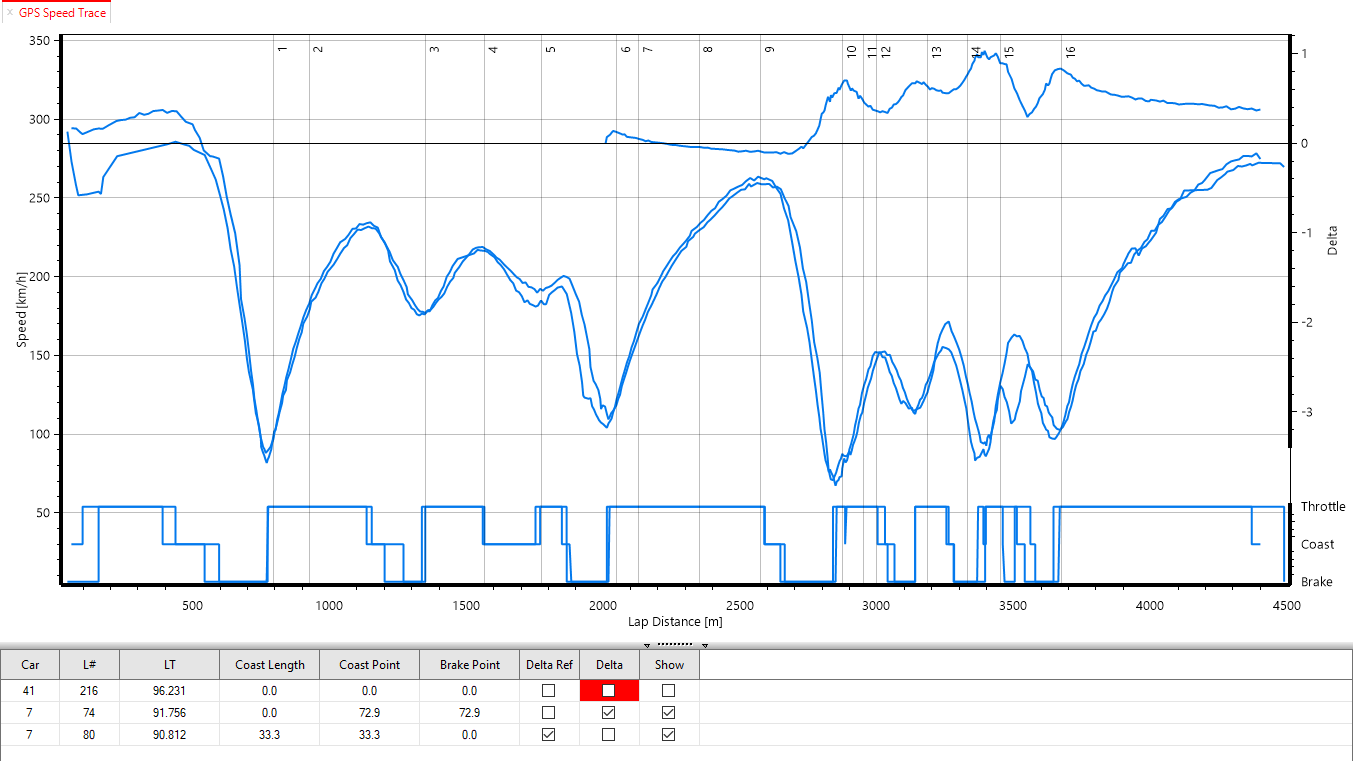
Delta ref and delta
The delta ref and delta checkboxes can be used to show a calculated time difference between two laps. Select a reference lap using the delta ref checkbox and then select a comparison lap with the delta checkbox. Double right-clicking at any point on the graph will set the start point for the calculation - in the following example the time difference is calculated starting at turn 6. To reset it, double click on the graph at x = 0 and the time difference over the full lap will be calculated.
Show
Laps can be hidden from the graph by unselecting these checkboxes.
GPS speed calculation algorithm
As mentioned previously the GPS speed has to be calculated from GPS position data which doesn't arrive with a consistent, reliable frequency and without any timestamp information. As such, there are some estimations made to detect situations when the incorrect time period is assumed. Initially the speed is calculated by calculating the distance between two consecutive latitude and longitude points, and dividing by a baseline time period value. This is done for all points. After doing this, there can be some large jumps in the data if the time period is incorrect. The max acc threshold field is used to remove any points with too large of a jump in speed due to the incorrect time period. This value should normally be left as the default, but can be tuned to change the appearance of the graph.