Overviews
Strategy overview
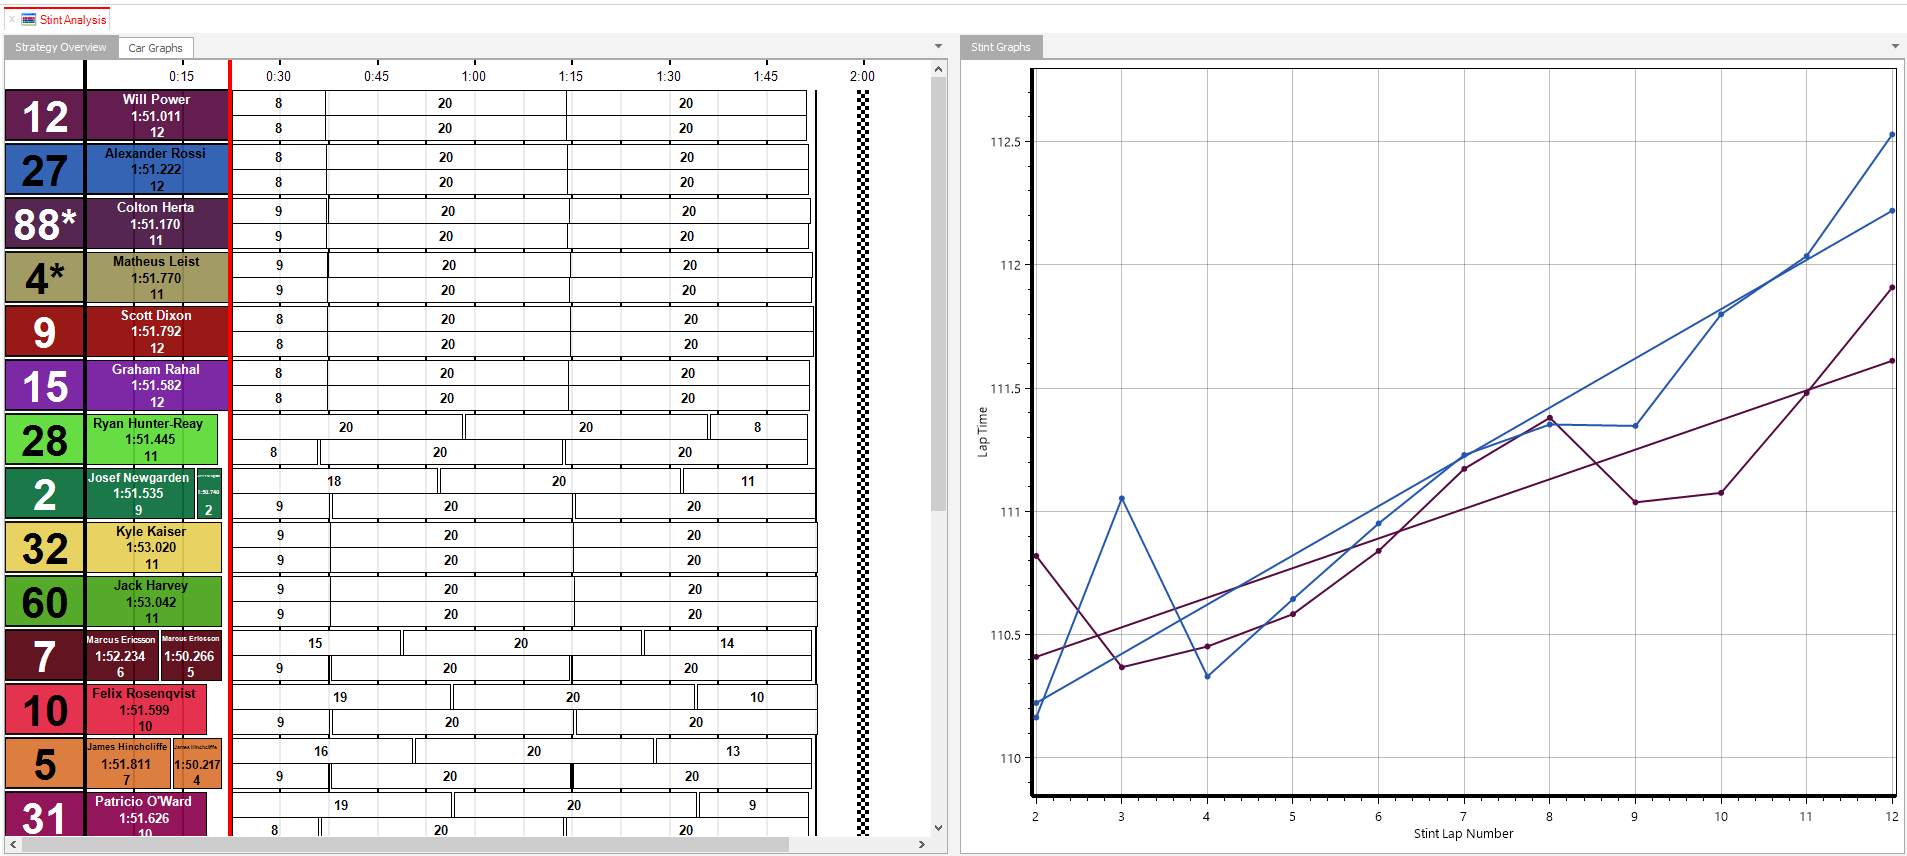
The strategy overview is designed to give an overview of all stints and pit stops for each car. Each row represents a car, identified by their number, and ordered by position, and the x-scale is time. Each block represents a stint, and the breaks between the stints represent the pit stops. This display easily allows you to see and compare the strategies used by different cars. The options for the strategy overview scoreboard can be found in the ribbon bar.
Note that the Race Duration field in the ribbon bar control is a reflection of what is shown in the Backstage Options for Session Settings. Modifying this value changes the session settings both in the Strategy Overview and the Backstage Options.
Default information
By default the information shown for each stint is:
- Driver name
- Sanitized average lap time
- Number of laps in stint

Future stints
The future stints can be shown for each car, one working forward from the current point in time and the other working backward from the end of the race to the current point in time. The overlap between these calculations provides a way to visualize the pit stop window for each car. One, both or no future predictions can be shown which is controlled in the ribbon bar.
Two methods are available to control the calculation of the future stints:
- Predicted Stint Lengths
- Fixed Stint Lengths
The choice of which method is used depends on the regulations of the event/series. You need to select it in the Backstage Options.
Modifying shown information
The information shown for each stint can be customized by using the Select Parameters button in the Strategy Overview ribbon bar control. Parameters can be added, removed, or re-ordered as required.
Annotations
Annotations can be added to the Strategy Overview as prompts or reminders. These can be added as areas or single lines as shown below.

Auto scaling in X direction
The Auto Scale Function (in the Appearance section of the Strategy Overview ribbon bar) can be used to automatically show the information on a time scale that is useful depending on what you are interested in. The different modes available are:
Complete Session - The time axis will show the entire duration of the session. This will match what the Race Duration is set to.
Time Elapsed - The time axis will automatically zoom to show the amount of the session that has elapsed.
Window - The time axis will be set to the value shown in the Auto Scale Window. If the value is set to 1, then the time axis will always be zoomed to 1 hour. The window will "move" with the race so the latest 1 hour is always shown.
Manual Mode - When Auto-Scale Enabled is unchecked, the horizontal scale can be manually set.
Note that when Auto Scale Enabled is checked, the horizontal scroll bar underneath the Strategy Overview is inactive.
Colour mode
Each stint can be shown with a different background colour:
- Driver - This option will use the colour from the driver in Car Options
- Driver Categorization - This option will use the colour from the driver categorization (in feeds where it is available)
- Car - This option will use the colour from the car in Car Options
- Average Lap Time Heat map
- Lap Time degradation Heat map
Currently, both the average and lap time degradation heat map are calculated per car.
Lap overview
The Lap Overview is similar in concept to the Strategy overview except the information is presented on a per lap basis when each block represents a single lap. The lap time for each lap is shown in each block.

A number of colouring conventions are available in the ribbon bar control:
- Colour blocks by car colour
- Colour In and Out laps
- Individual best lap colouring
- Colour laps with heat map by stint
- Colour laps with heat map by all laps
- Add border lines to blocks by car colour

Track status
In both Strategy Overview and Lap Overview you have an area on the top displaying track status:
The following informations are displayed:
- Full Course Yellow in purple
- Safety Car in yellow
- Slow zones in green and yellow striped
Stint analysis
A new control was introduced in this version to compare stints. It is called Stint Analysis. This control is still in development. It can be found on the Ribbon bar under the Overviews sections:

The goal of this control is multiple:
- In practice to predict pace/lap time degradation by combining multiple stint
- In races, to detect pace/lap time degradation

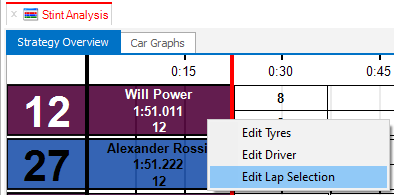
The laps used to calculate the tire degradation can be manually edited by doing a right click on each stint:

Stints can be combined, also by doing a right click on each stint (that is not the first one):
