Making reports
There are 3 report types currently available in HH Timing:
Quick Report
The purpose of the Quick Report is to copy the displays currently open in your project to an HTML report. The filters and configuration of each display in the project will be respected and replicated when the report is generated.
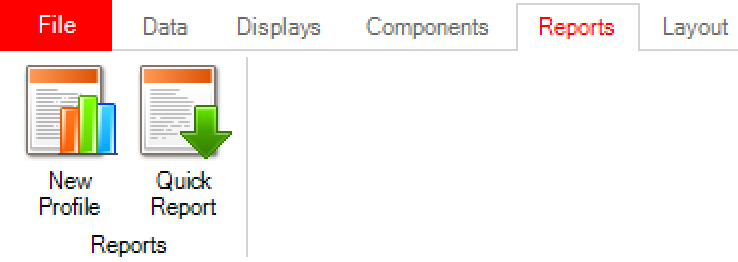
The button to access the Quick Report is in the Reports tab as shown below:

When the Quick Report button is clicked each display is copied to an HTML file and will open automatically with the users default browser. If needed this file can be saved for sharing from within the browser.
In the following example, the display layout in the project includes:
- Main Scoreboard
- Raising Average Graph
- Car Scoreboard for Car #1 (behind Raising Average Graph)
- Best Sector Scoreboard
Each of these displayed will be copied to an HTML report.
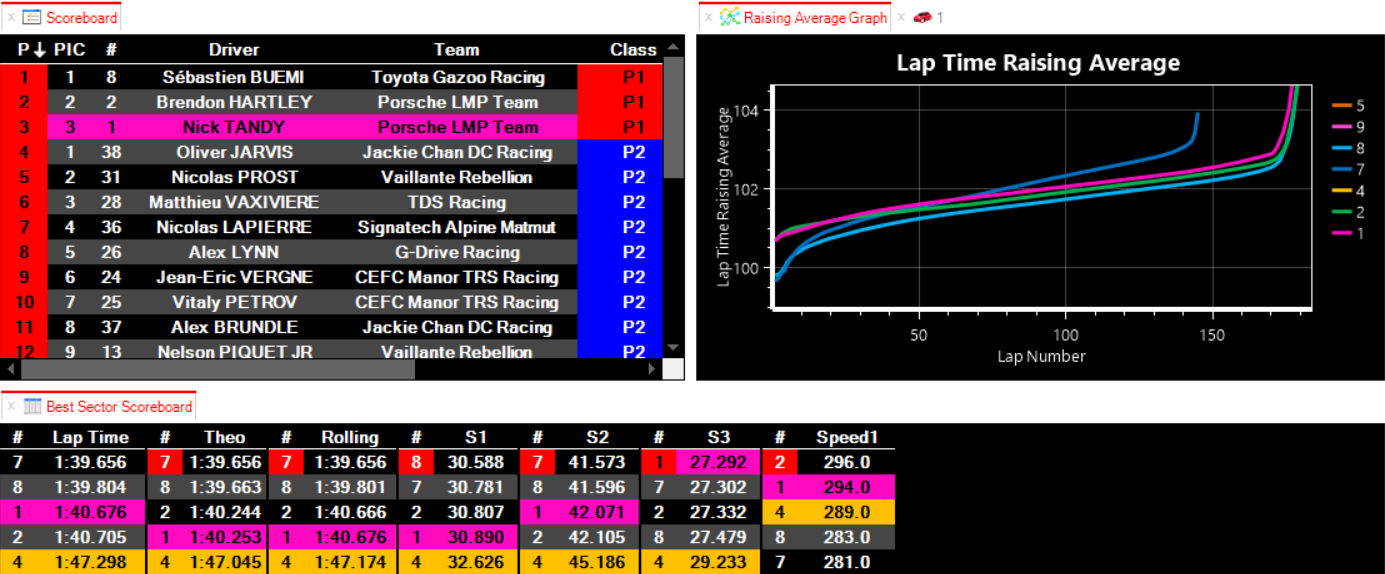
Note only displays relevant to a report will be printed, track maps for example will not be added to the report.
Auto Report
Auto Reports are intended to produce detailed reports of a standard format quickly with minimal user input. To make a new Auto Report profile, click the New Profile button in the Reports tab.
This will give the user the option to name the report profile. Any existing report profiles in the current project will be shown here at the same time.
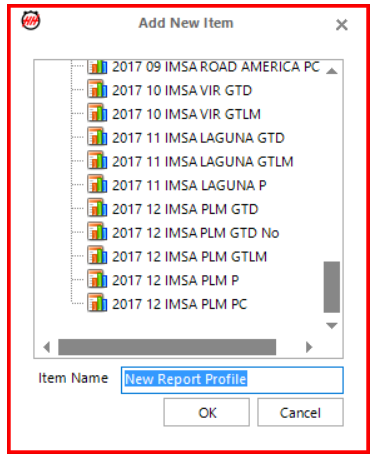
Note that once the new profile is created it can be found in the project tree on the left side along with the other existing report profiles in the project.
Once OK is clicked the new report profile will open to Report Configuration title page. Here the details that will show on the title page can be entered as below. Any car numbers entered in the "Car(s)" field will be summarized at the start of the report in a table listing the drivers and reporting colour.
Note that for the title page to be included in the report the "Include Title Page checkbox but be selected.
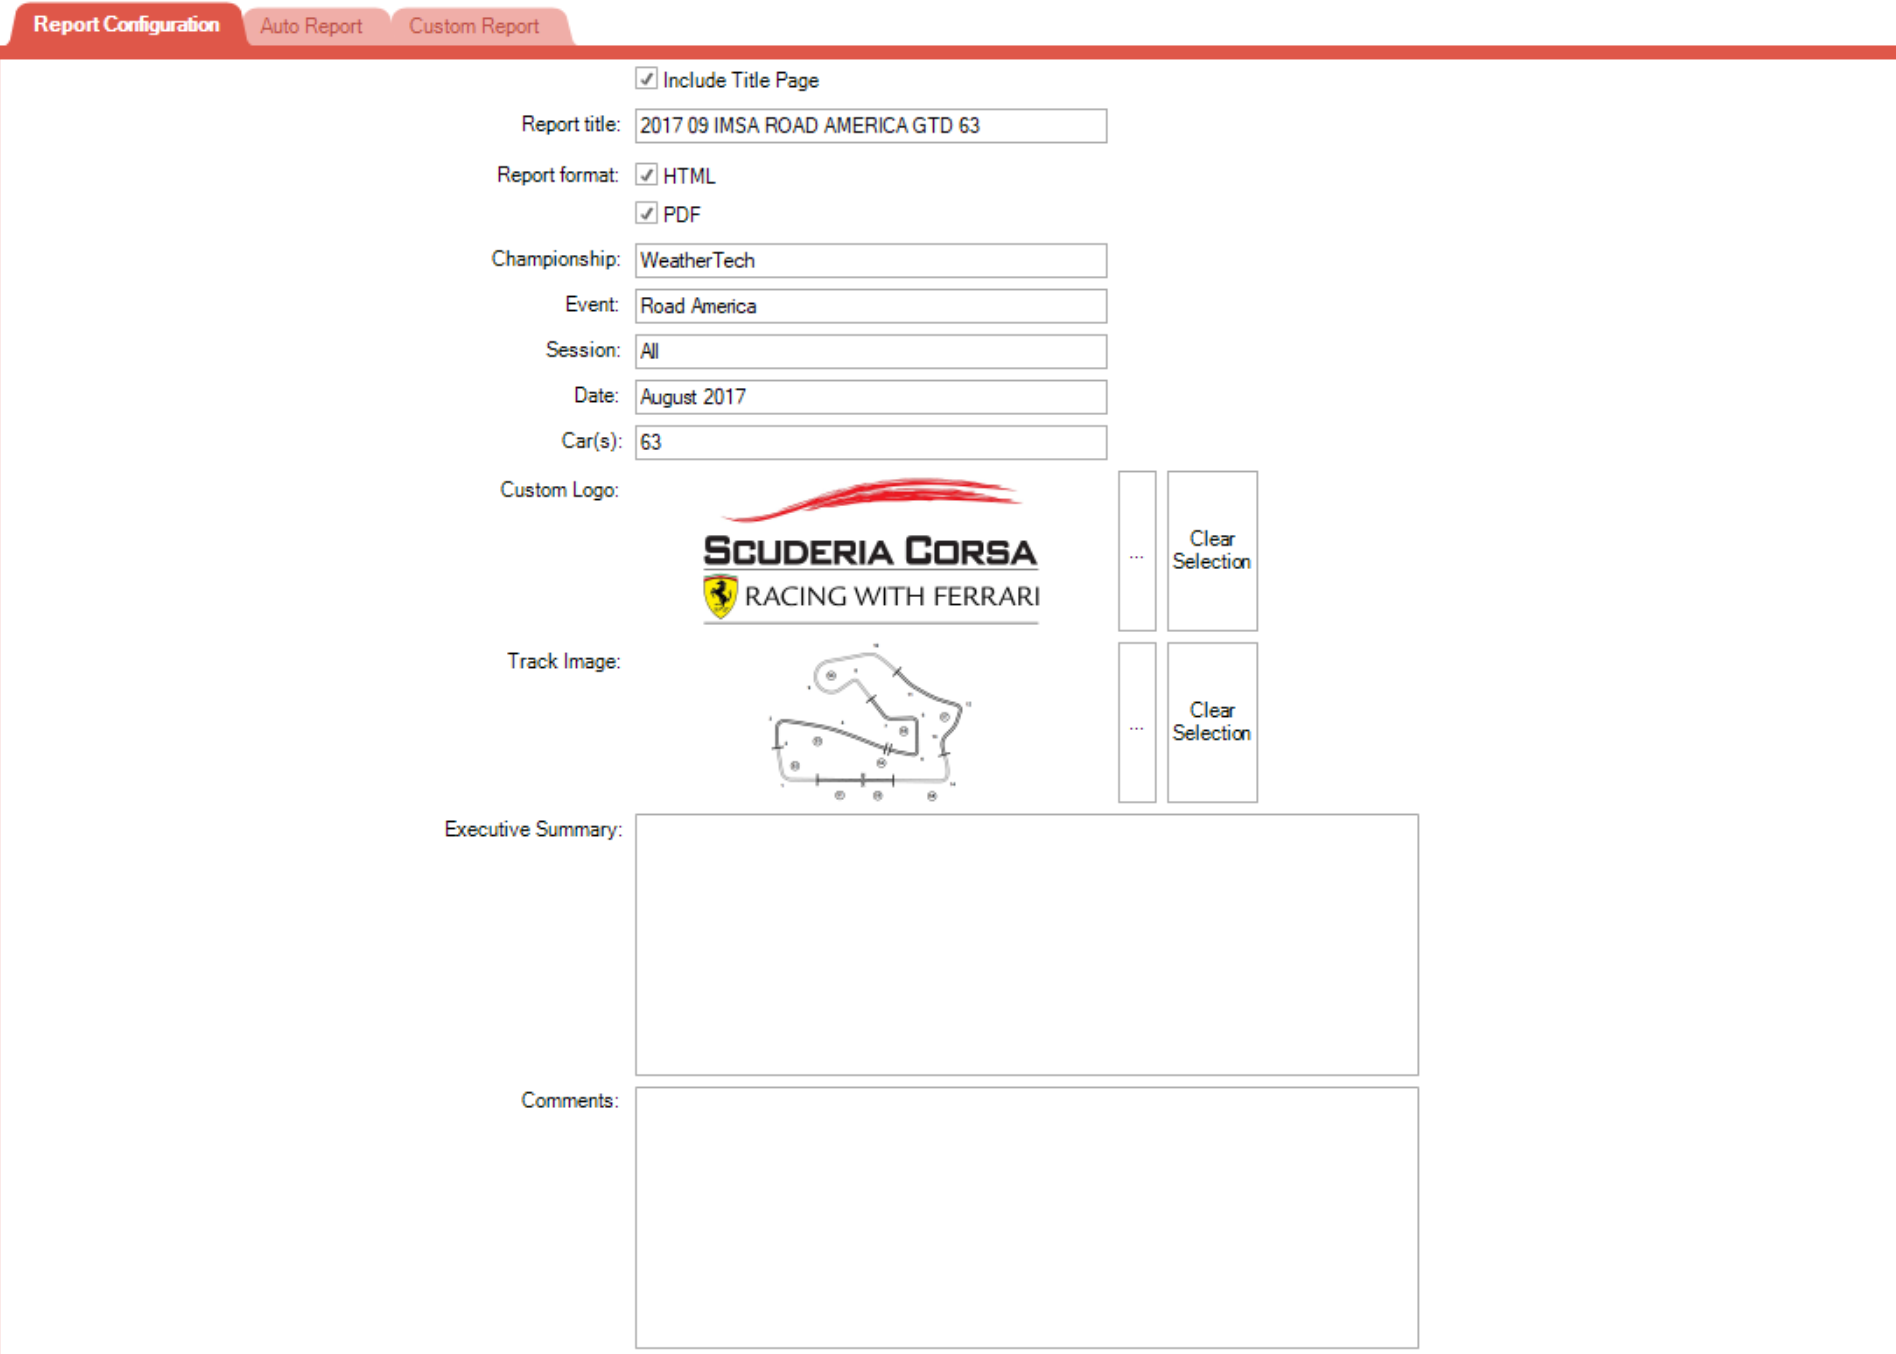
Note that the "Report title" field determines the name of the file that will be saved.
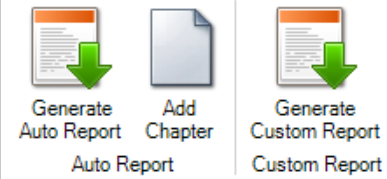
To define the contents of report, select the Auto Report tab. Click the Add Chapter button in the report ribbon bar control to add the first chapter to the report. A chapter is generally used for each session, so in a single report a chapter would be defined for each session:
- Each Free Practice
- Qualifying
- Race
When a new chapter is created is looks as below.
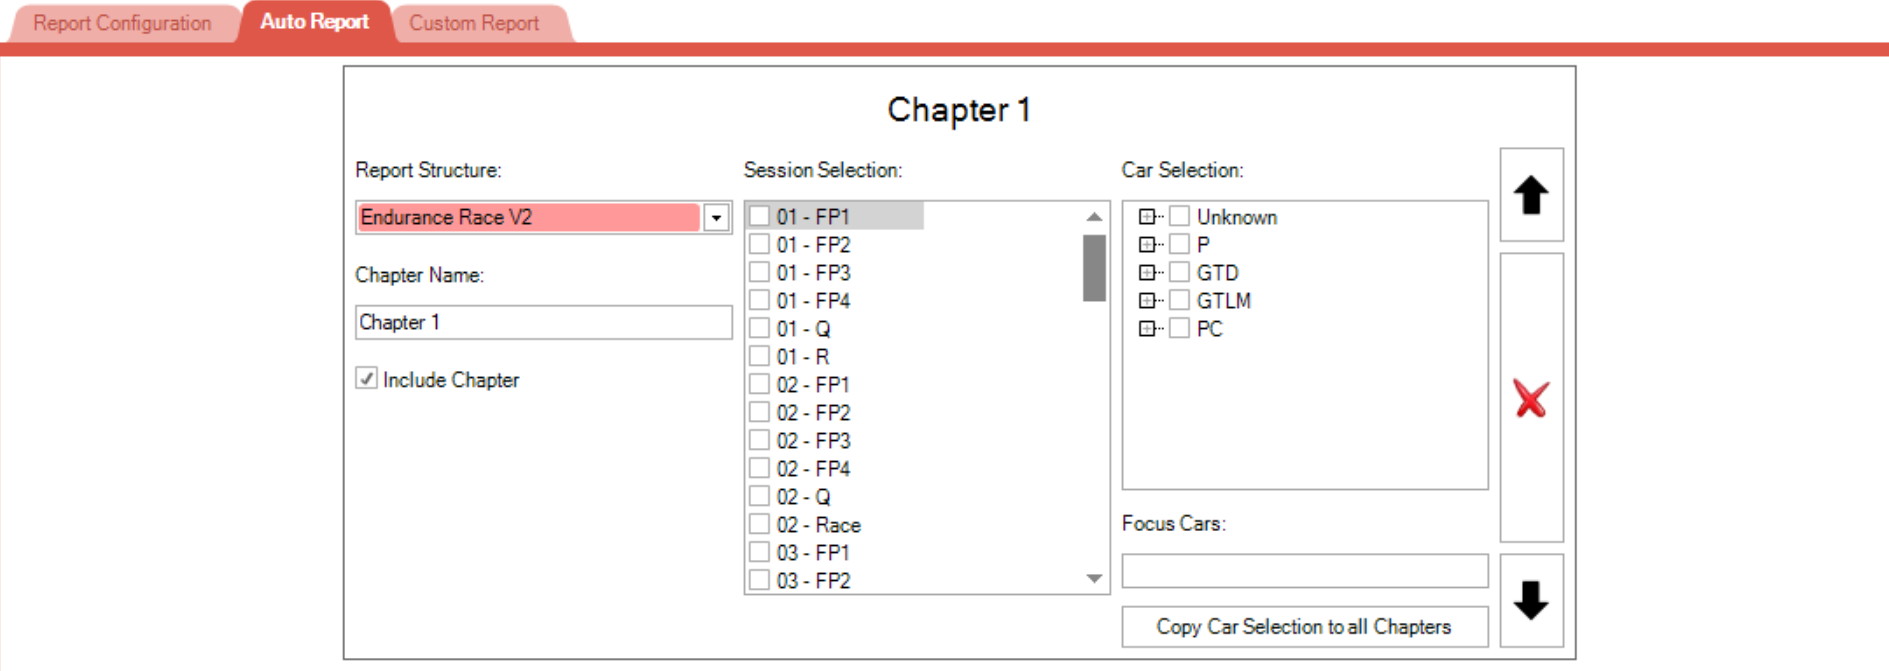
Report Structure
The report structure defines the template type for the chapter. Currently the available structures are:
- Endurance Race
- Endurance Timed Session
- Multi Session Summary
Note the Multi Session Summary is designed to have multiple sessions selected, where as the other report structures can only have a single session selected.
Chapter Name
Defines the name for the chapter. FP1 for example.
Session Selection
Defines which session will be reported on in that chapter
Car Selection
Defines which classes will be included in the chapter. These can be expanded to select/deselect specific cars.
Focus Cars
Defines any cars to be included in more detailed analysis. Typically this would be used for the team cars only. Some extra plots are included and tables are highlighted for the focus cars.
Copy Car Selection to all Chapters
Copies the car selection of that chapter to all chapters in the report. This saves time making car selections when many chapters are included in a report.
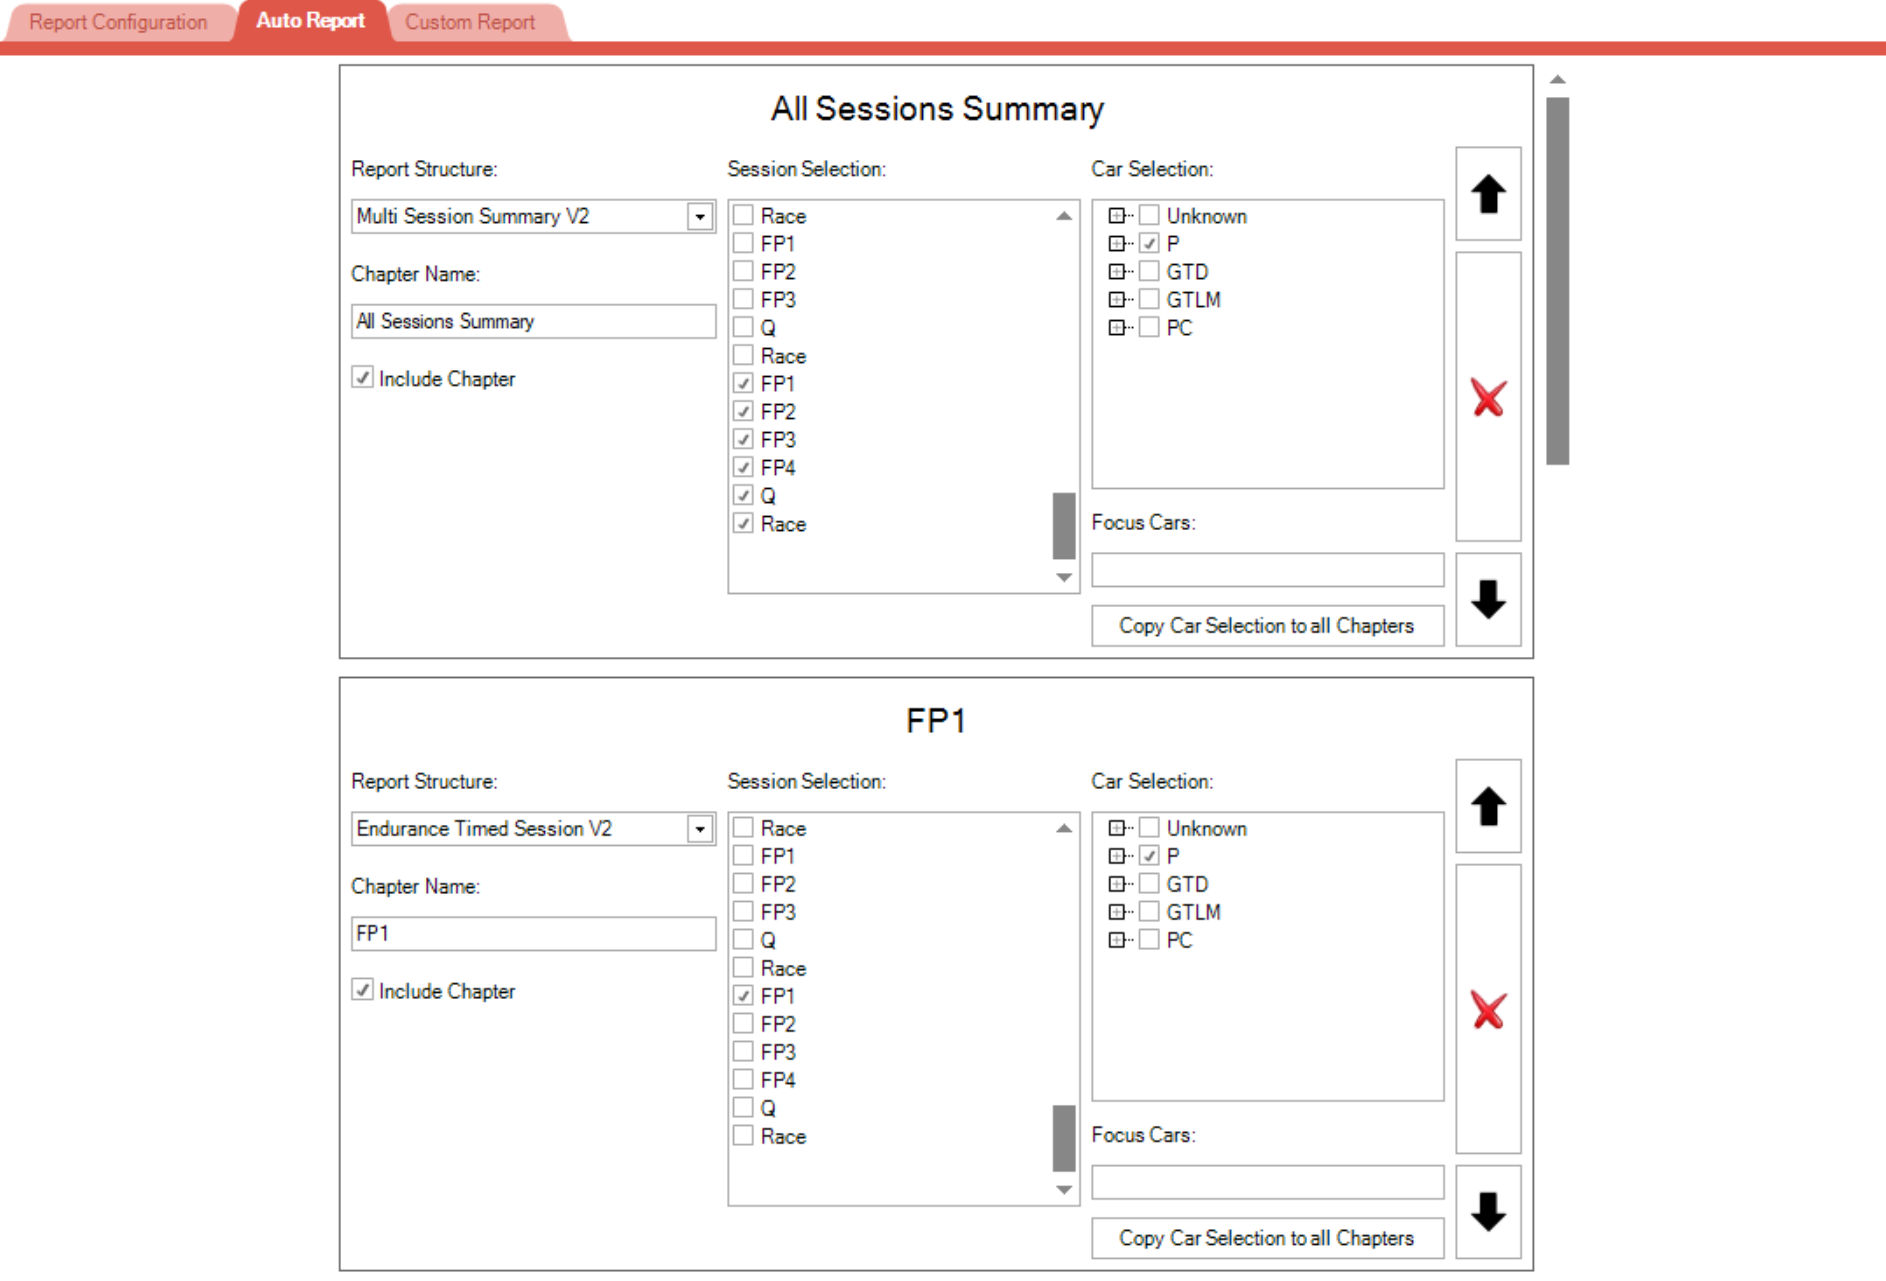
In the example below there are 7 chapters included in the report, one each for:
- All Sessions Summary
- FP1
- FP2
- FP3
- FP4
- Q
- Race
As shown the All Sessions Summary chapter uses the Multi Session Summary V2 Report Structure and all sessions from the weekend are selected. In the FP1 chapter only the FP1 session is selected. All cars in the Prototype class have been selected and no Focus Cars are defined.
To generate the report, click the Generate Auto Report button in the report ribbon bar control. The report will open automatically be opened in the formats defined in the Report Configuration (HTML, PDF or both).

They will also be saved locally on the computer to the following directory:
C:\Users\USER NAME\Documents\HH Timing\Reporting
Custom Report
The custom report is similar to the Quick Report in that it is based on the displays and data that are currently active in the project. The difference being:
- A title page can be defined in same way as Auto Report
- The report is saved to the same directory as the Auto Reports when generated
- The user has control over the order each display is shown
- Displays can be removed from report
- The format is saved and can be reused in future with other sessions
Once inside the Custom Report tab, clicking the Populate Report button will copy all displays that are currently active in the project. An example of this is shown below:
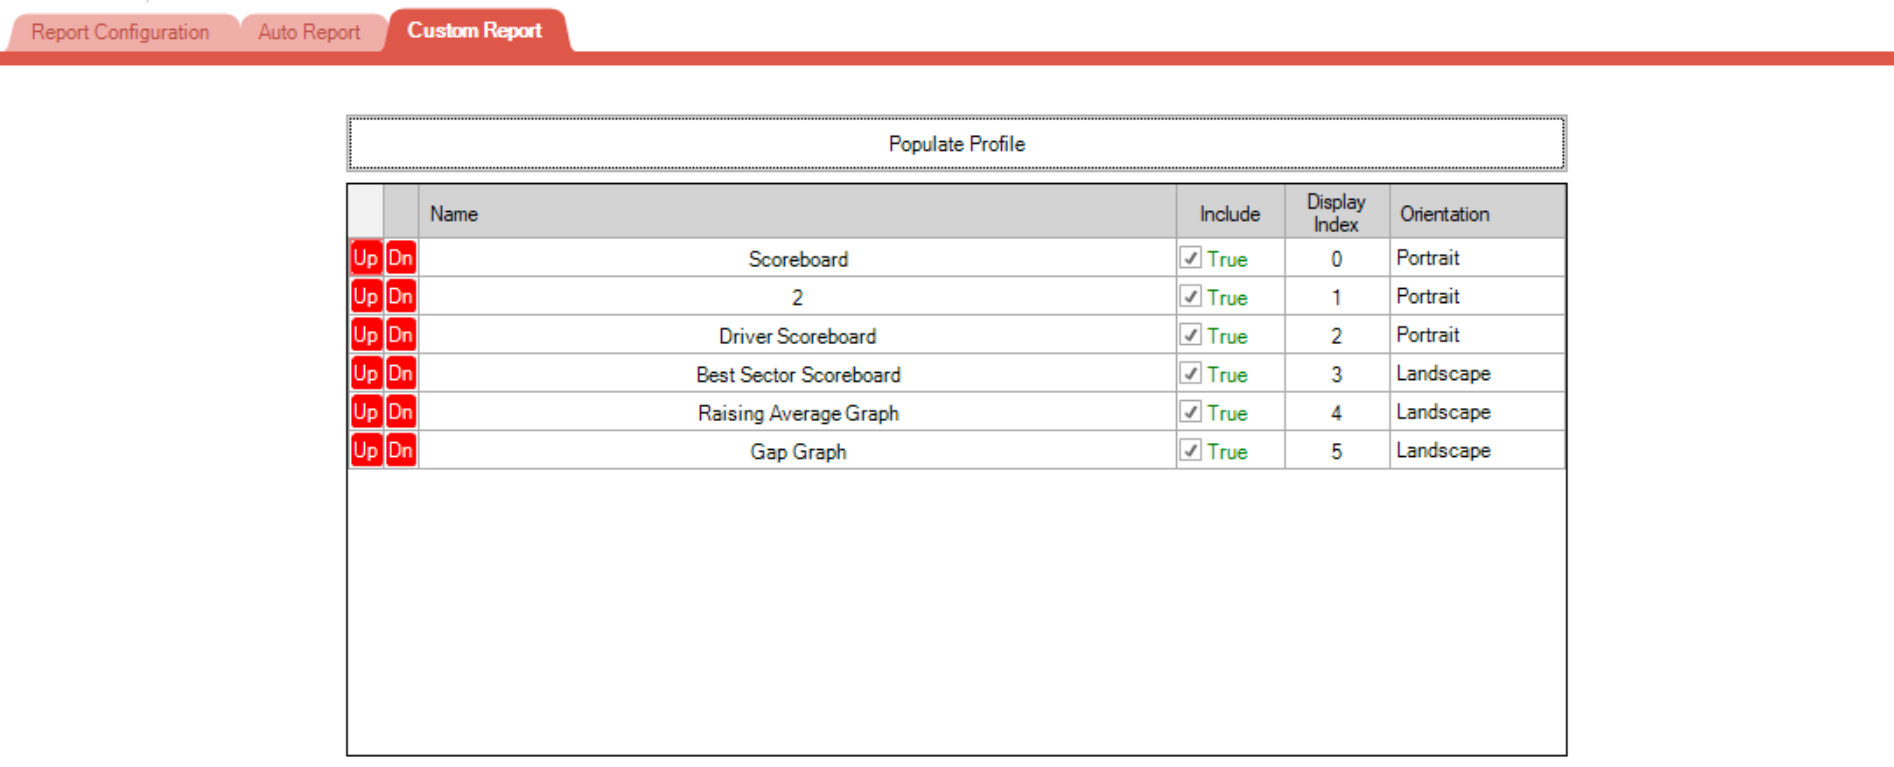
At this point the order or each display and what is included can be modified. Click the Generate Custom Report button in the report ribbon bar control to generate report. The report will automatically be opened in the formats defined in the Report Configuration (HTML, PDF or both).

They will also be saved locally on the computer to the following directory:
C:\Users\USER NAME\Documents\HH Timing\Reporting