Strategy Overview
The Strategy Overview shows all stints and pit stops of every car. Each row is a car, ordered by position, and the horizontal axis is the session time. Each block is a stint and the gaps between the blocks are the pit stops. By default each block shows the driver, the average lap time and the number of laps.
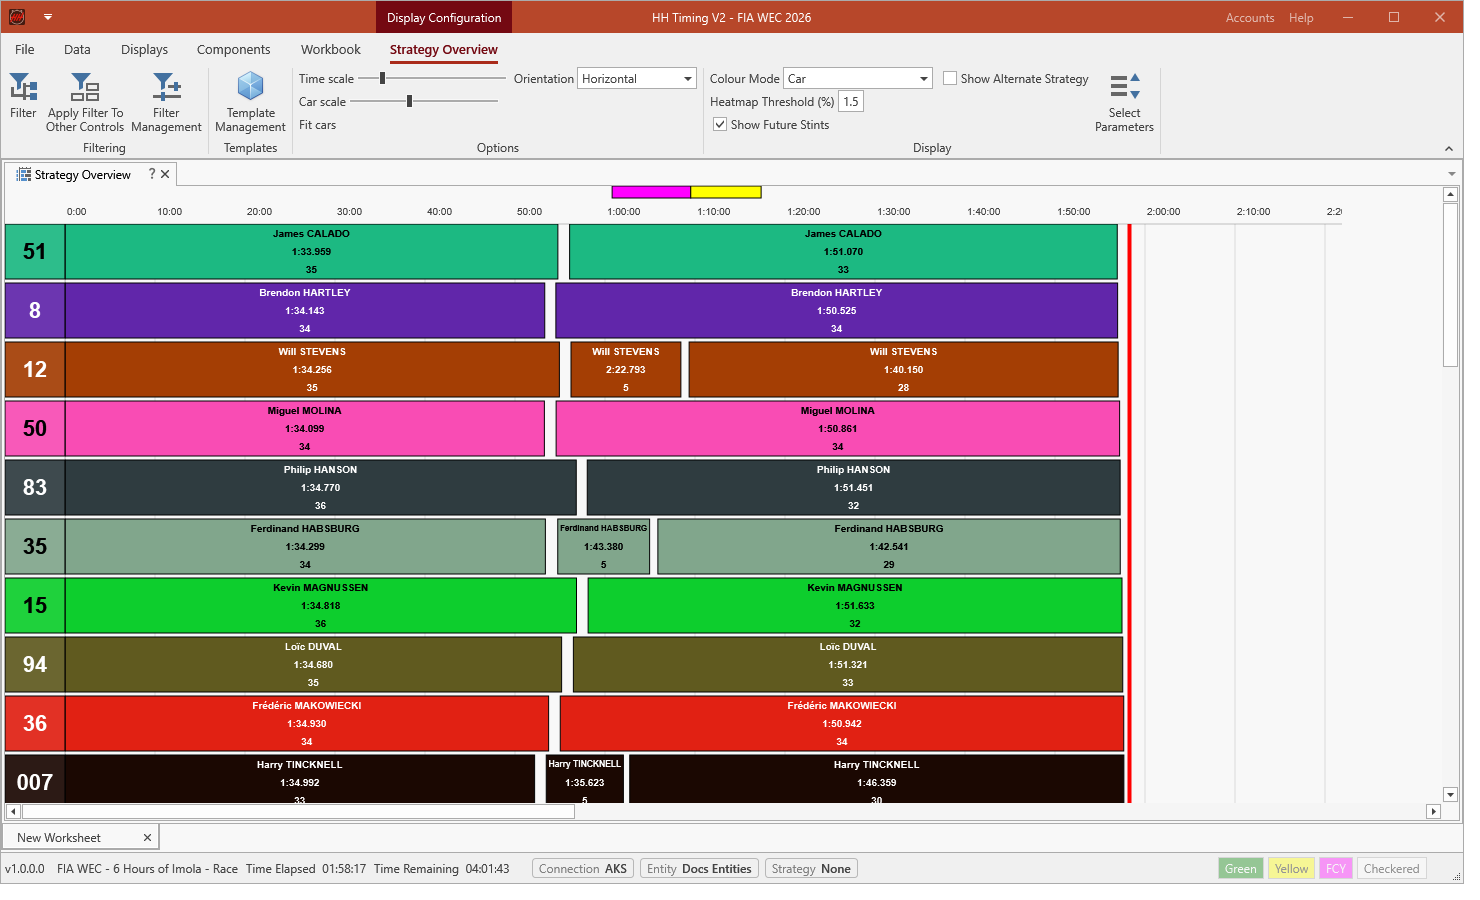
- Time scale and Car scale zoom the overview; Fit cars fits all cars in the panel.
- Orientation shows the cars as rows or as columns.
- Colour Mode colours the stints by car, driver or as a heat map; Heatmap Threshold (%) sets the range of the heat map.
- Show Future Stints adds the predicted stints until the end of the race; Show Alternate Strategy adds a second prediction.
- Select Parameters chooses the values shown in each stint.
The bar above the time axis shows the track status, for example yellow and virtual safety car periods.
See Predicted Stint Length for how future stints are calculated.